

Research HighlightsSeeing beyond the naked eye
Advancing digital imagery in soybean management
By Peter Kyveryga, Iowa Soybean Association Director of Analytics
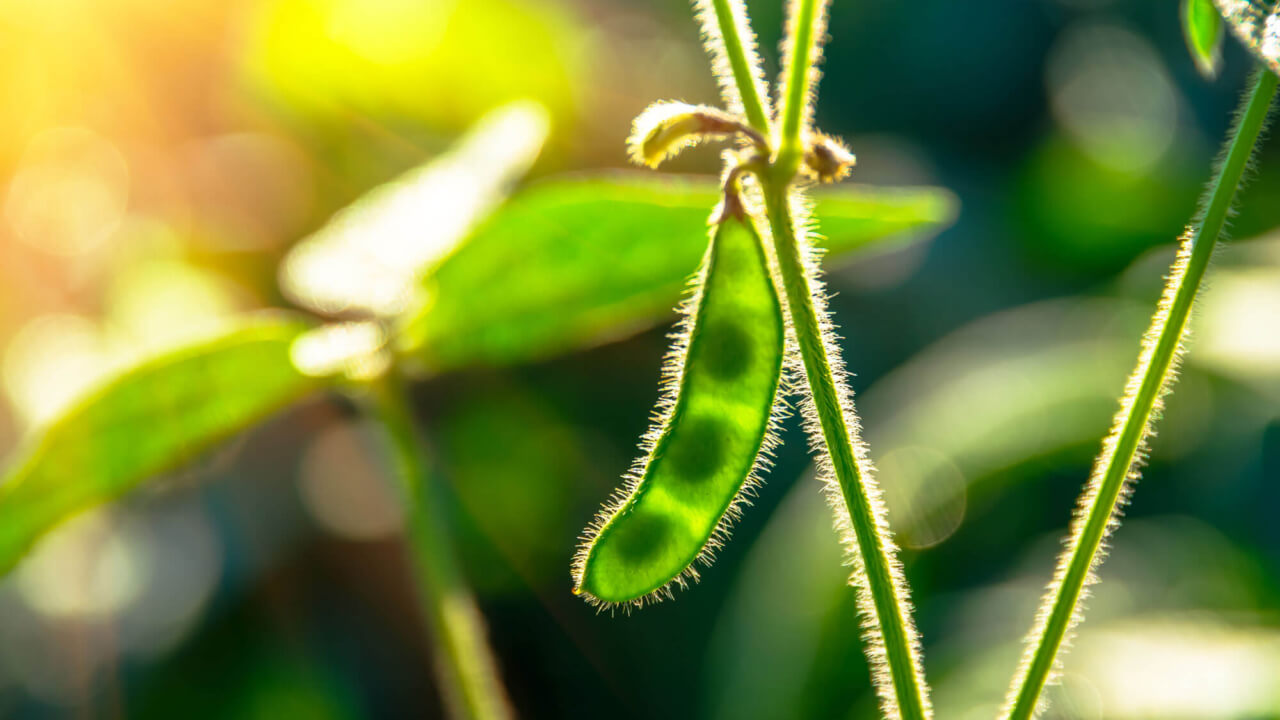
Precision agriculture today goes above field level. Photos captured with specialized cameras high above the crops are used to get the most accurate data for optimum performance.
This imagery consists of two parts: visual, what can be seen with our eyes; and digital, the invisible data behind the image.
The Iowa Soybean Association (ISA) Analytics team is working with two farmers, several commercial imagery providers and university partners to test different imagery systems to best detect plant stress, predict yields and measure calibration quality.
“Visually assessing aerial images alone is often quite limited compared to what the invisible data may reveal,” says Brad Wirt, ISA GIS specialist. “The digital aspect of the imagery is critical for analysis.”
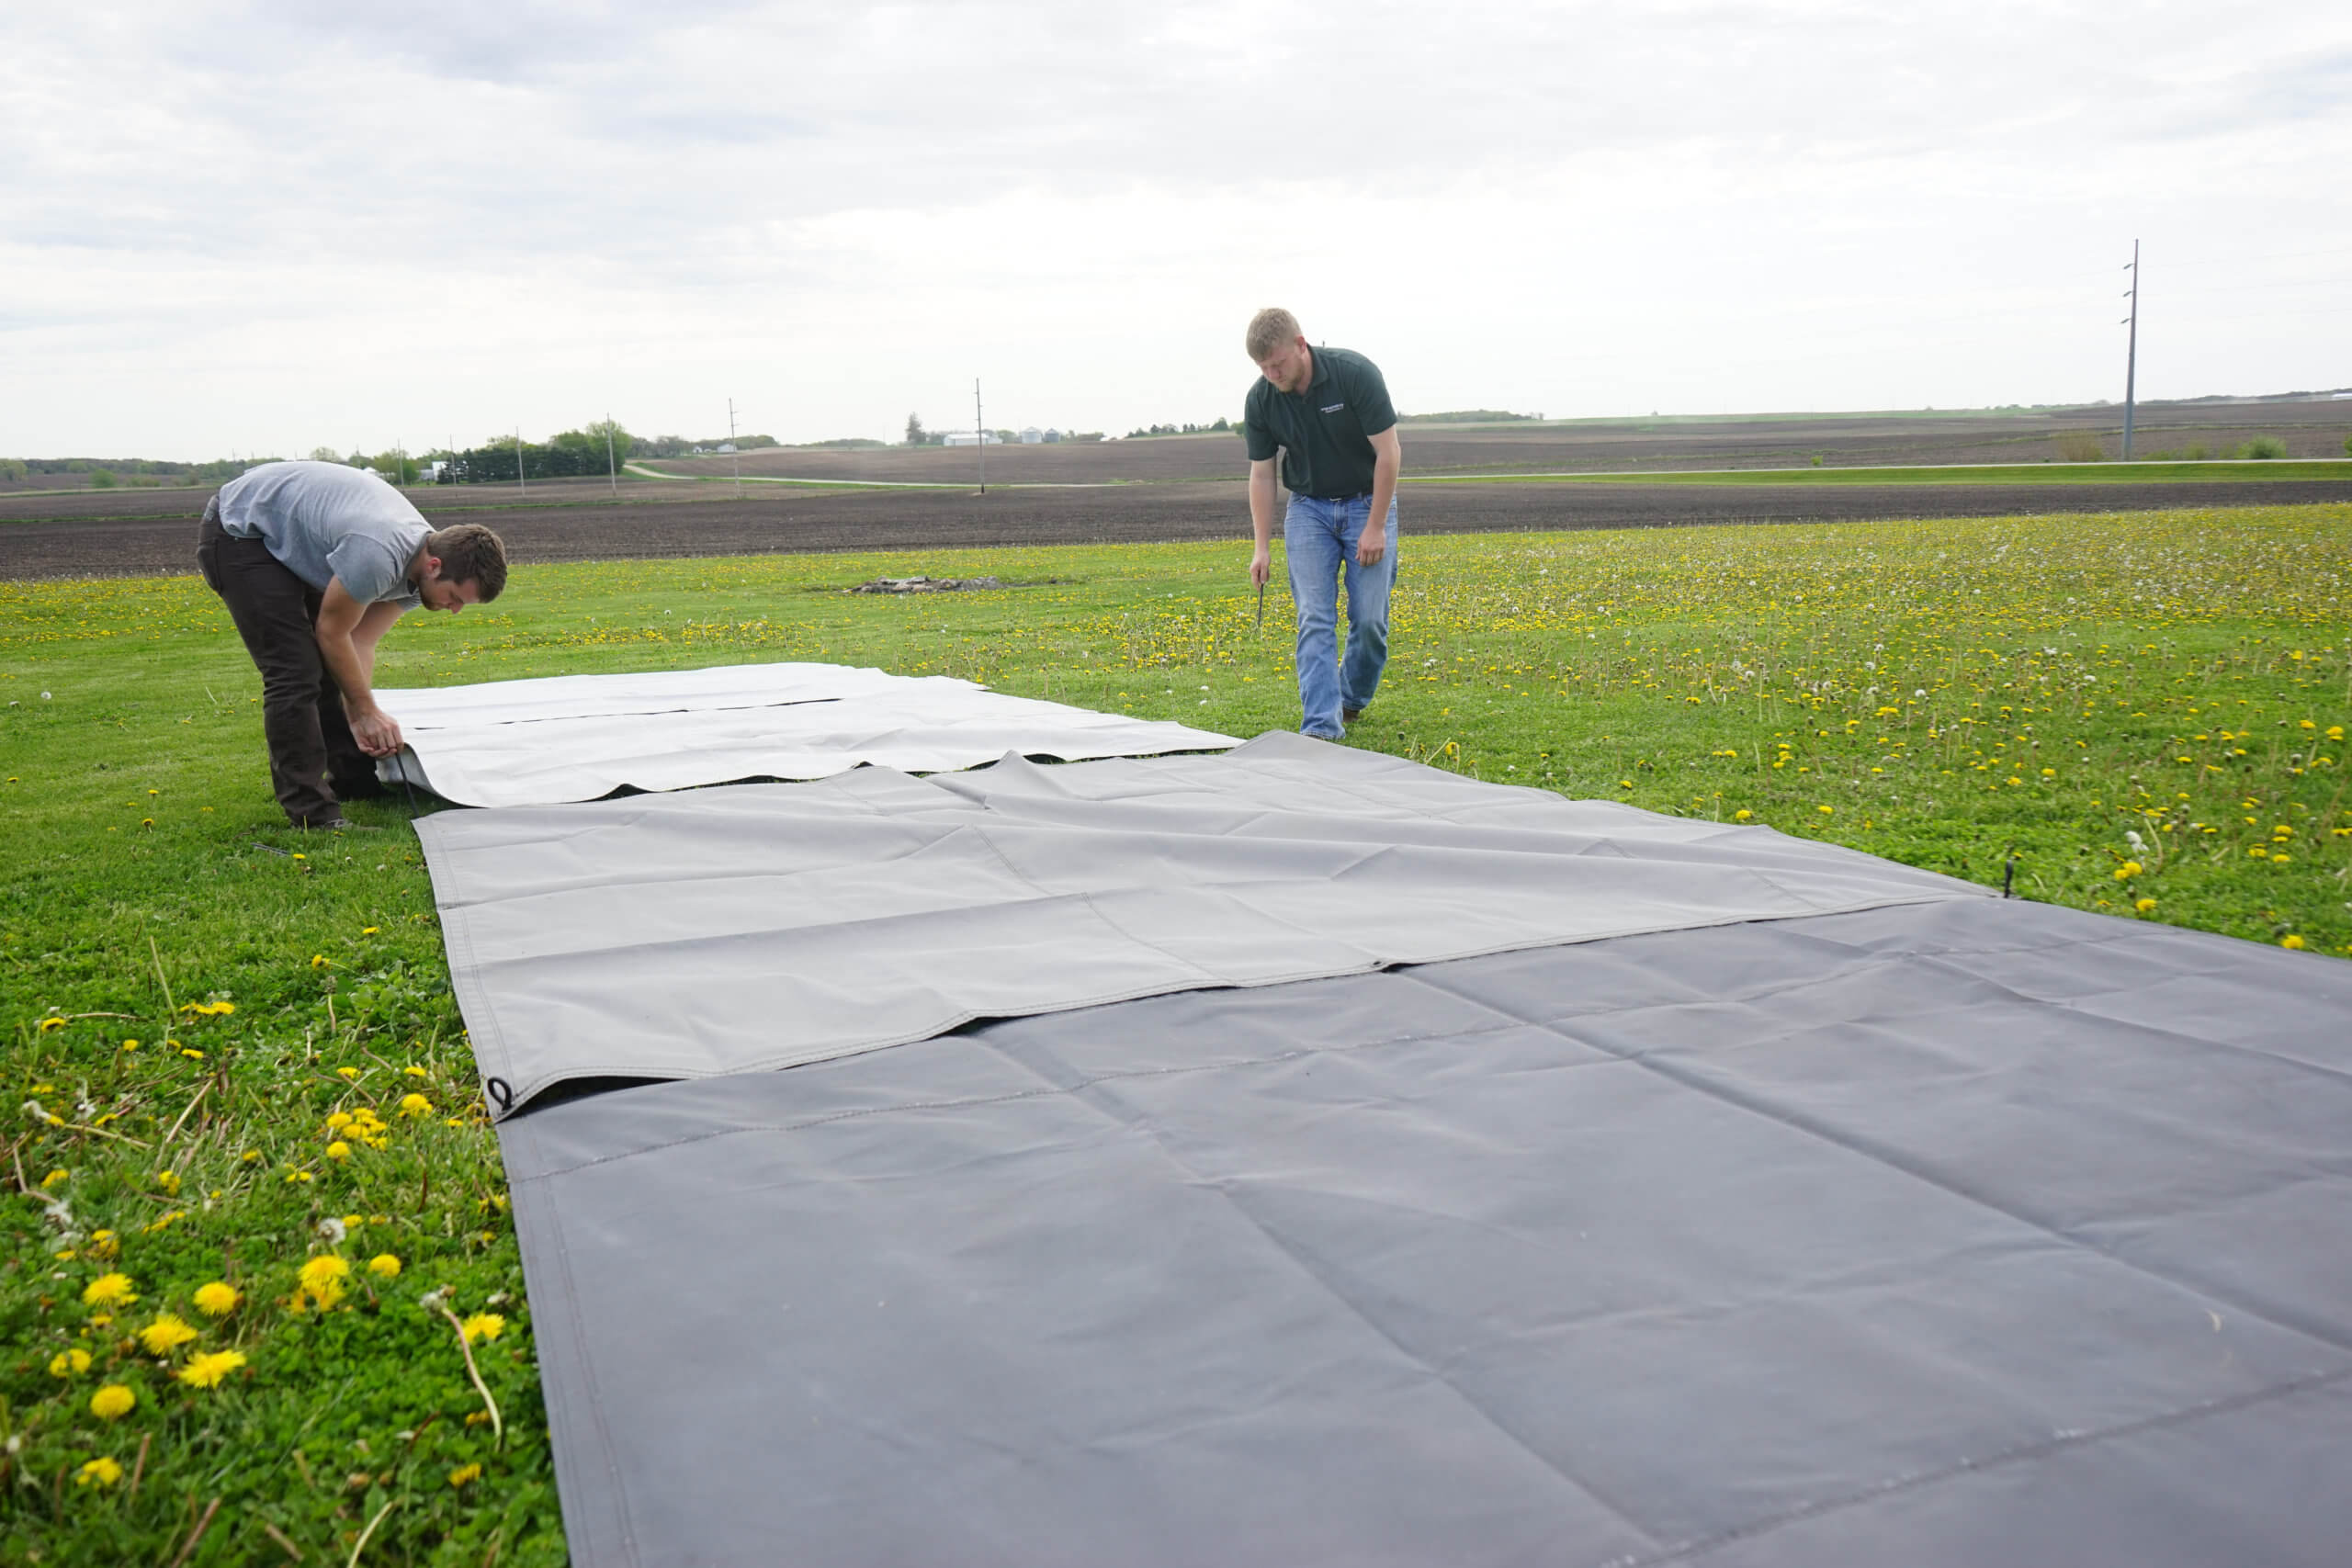
The Analytics team studies images captured by airplanes or drones that fly over two specific fields every seven to 14 days during the growing season. Calibration is important for accurate image comparison. Calibration tarps — with reflectance values from very dark (3 percent reflectance) to very bright (56 percent reflectance) — are placed next to the fields and included in each image as a consistent baseline.
The ISA Analytics team examines each image for spatial accuracy, spectral color band integrity and the ability to seam images together into one composite picture. Inaccuracies in these aspects can easily be detected by experts. However, for farmers and agronomists, spotting the inaccuracies can be challenging. For example, if the collected imagery is used to target weed spraying, an error of 15-30 feet in spatial accuracy could result in spraying the wrong areas.
Calibration imagery quality
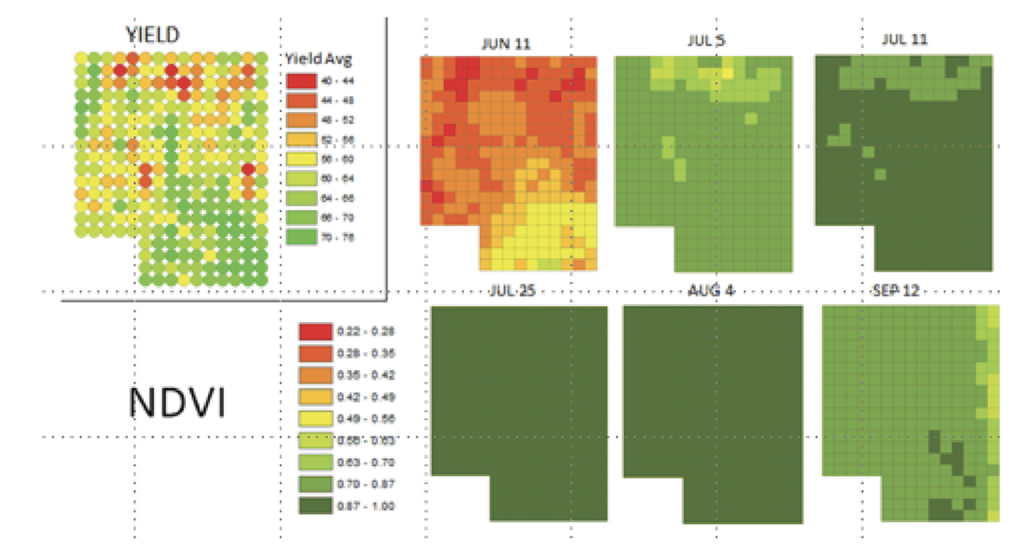
Vegetation indices are commonly used to measure crop growth and biomass through light wavelengths and plant reflectance. A ratio of a percentage of red (RED) and near-infrared (NIR) reflectance is used to produce a Normalized Difference Vegetative Index or NDVI.
Uncalibrated NDVI values show variations within a given field. However, these differences are only relative for the specific date. Comparisons between uncalibrated images over time and between fields can be misleading. In contrast, NDVI of calibrated imagery can be compiled into a time series to differentiate yield zones and allows researchers to assess the magnitude of stress over time.
Even for calibrated imagery, NDVI values often saturate, or reach a maximum level, later in the growing season. Important differences in soybean biomass or yield cannot be differentiated. The Analytics team also uses the Triangular Vegetation Index (TVI), which has values that saturate less than NDVI at the end of the season.
Other resources:
Integrated research & education program for use of remote sensing and UAV’s for enhanced soybean production
Published: Dec 5, 2019


