

Research HighlightsPost-Harvest Measurement of Soybean Seed Number and Seed Mass Contributions to Final Seed Yield
By Jim Specht, Emeritus Professor of Agronomy, University of Nebraska-Lincoln
Jenny Rees, Extension Educator, University of Nebraska-Lincoln
Shawn P. Conley, Professor, University of Wisconsin
Soybean seed yield has traditionally been defined as a function of the five factors shown below in the mathematical equation. The 60-pounds-per-bushel factor is the soybean volume-weight standard established by the USDA in 1925.
Equation 1
Seed Yield (bushels/acre) =
[(plants/acre) x (pods/plant) x (seeds/pod)] ÷ [(seeds/pound) x (60 pounds/bushel)]
The use of this equation to generate pre-harvest yield estimates has been described in extension publications (e.g., Lee and Herbek, 2005; Licht, 2023). Late in the reproductive period, field-representative plant stand counts can be taken to estimate the final plant population. Then, a random sample of plants can be collected to obtain an estimate of pods per plant. Although pods could be sorted into one-, two-, three- and four-cavity pod categories, this is rarely done. Instead, a value of 2.5 seeds per pod has been found to be a useful rule-of-thumb number for this factor.
The seeds per pound factor is not truly measurable until all pods and seeds attain full physiological maturity. Its final value will be dependent not only on the soybean variety, but also on the weather that prevailed during reproductive development. The number of seeds per pound is printed on the tag of a bag of varietal seed and could be put into the equation, but that value may need adjustment upward or downward to reflect the producer’s perception of how much the weather has (so far) enhanced or depressed final seed size. Making weather-related adjustments of a varietal seeds per pound value is not unusual, given that most seed variety catalogues show a +/- 300-seed range around the centric mean seeds per pound value for the seed.
Producers are now harvesting their 2023 soybean fields, and thus may be keenly interested in how their pre-harvest yield estimates compare with post-harvest reality. Unfortunately, their combine yield monitors are likely displaying the impact of the 2023 growing season weather pattern — which was mostly wet and cool in July during the seed number setting stages of R1-R2 (flowering) and R3-R4 (podding), but then was mostly dry/hot in August during the seed mass setting stages of R5-R7 (seed-filling). This 2023 weather pattern has resulted in a reduction in the size of the harvested seeds, which means that more (small) seeds will be required to make up a pound. This impact is not unexpected based on prior research (see the companion CropWatch article).
Using a Condensed Yield Equation for a Post-Harvest Yield Component Analysis
Soybean seed yield is ultimately a function of just these two key components: (a) the number of seeds harvested per unit of area, and (b) the number of seeds per unit of mass weight. Here, we condense the previous equation to create a more simplified biophysical equation that producers can use in a post-harvest yield component analysis.
Equation 2
Seed Yield (bushels/acre) =
[(Seeds/square foot) x (43,560 square feet/acre)] ÷ [(Seeds/pound) x (60 pounds/bushel)]
An intrinsic property of this equation is the n-1 degrees of freedom, meaning if values are measured or estimated for any two of the three equation variables, then the value for the other variable is instantly knowable (via rearrangement of the equation). This is evident in Table 1. The left column displays vertically arrayed data cells whose values range from 100 to 500 harvested seeds/square foot of ground area. The horizontal row across the top displays data cells whose values range from 4,000 to 1,500 seeds/pound (i.e., from small to large seeds). The body of the table displays soybean seed yield data cells, wherein each has a value derivable from the intersection of a left column data cell with a top row data cell.
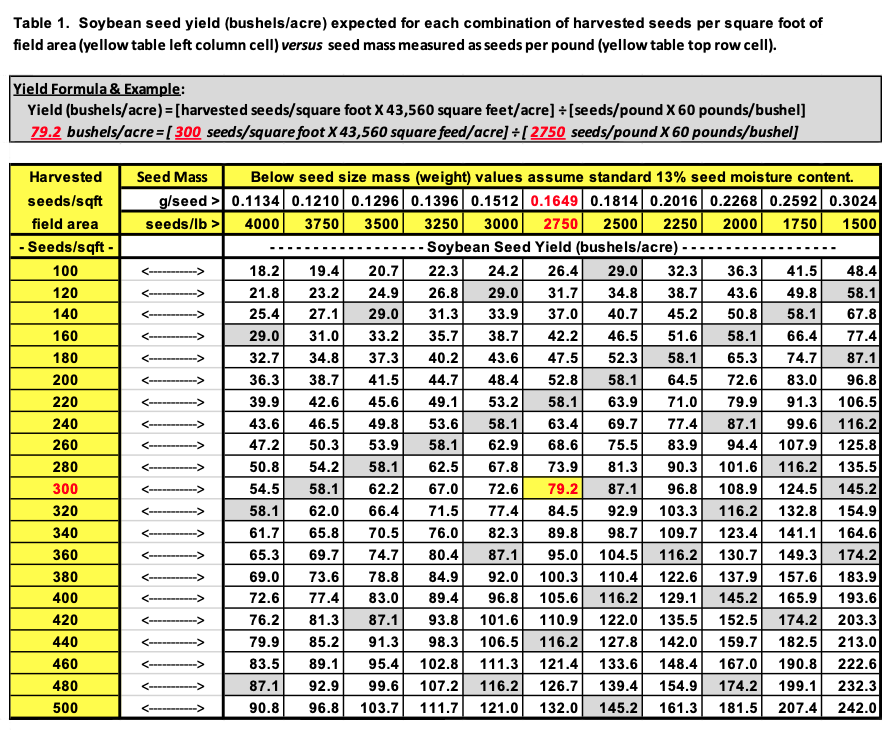
To adjust X seeds per pound at a zz% seed moisture to get Y seeds per pound at a market standard 13% seed moisture, multiply X seeds per pound at zz% moisture by [(100-zz) ÷ 87] to adjust seed number per pound to 13% seed moisture. Example: If zz% = 15%, then: (2,815 seeds per pound at 15%) x [(100-15) ÷ 87] = 2,750 seeds per pound at 13%.
If you know the field plant population, divide X plants per acre by 43,560 square feet per acre to get Y plants per square foot. Then, divide the seeds per square foot value for that field (i.e., left table column cell) by Y plants per square foot to get an average number of seeds produced per plant in the field. Assume you had 100,000 mature plants per acre. Example: 300 seeds/sq ft ÷ [100,000 plants/acre ÷ 43,560 sq ft/acre] = 131 seeds produced per plant in the field.
*Note: If you collect 10 consecutive plants from a row in your field, you can count the total number of pods present on the 10 stems and branches. Then divide that stem+branch pod total by 10 to get an average pod number per plant. Example: Assume you did this 10-plant pod count and found an average of 52 pods per plant. Assuming a 131 seed per plant value as shown in the prior example, then 131 seeds per plant divided by 52 pods per plant = 2.50 seeds per pod.
As an example of reading this table, assume that the soybean yield was 58.1 bushels per acre. That yield could have been obtained from the harvest of 320 seeds per square foot, but only if the seed mass was 4,000 seeds per pound (very small seeds). Alternatively, if the seed mass is 1,500 seeds per pound (very large seeds), the yield could still be 58.1 bushels per acre, but only if 120 seeds per square foot were harvested.
A Post-Harvest Protocol for Assessing the Seeds/Pound Component of Seed Yield
How can soybean producers conveniently and quickly measure the post-harvest seed mass yield component shown in the above yield equation? Here, we provide readers with a protocol for measuring seed mass using a seed sample collected from their combine hopper to assess that yield component’s contribution to the bushel/acre yield values seen on the yield monitor. A remote on-the-go measurement would be useful for those who want a quick answer, though others will want to wait until multiple seed samples are randomly collected from across the entire field and a final field yield value has been determined.
In Table 1, just above the row of seeds/pound data cells, is a row of data cells containing the matching values of grams/seed. That correspondence is based on a grams-to-pounds equivalency constant shown in the last term of this equation:
Equation 3
Seeds/pound = [(1 ÷ grams/seed) x (453.59 grams/pound)]
It is not necessary for a soybean producer to collect at least a pound of seed from the combine bin, and then take the time to tediously count the thousands of seeds in that sample pound. Instead, one can simply use a 50- or 100-hole seed counting plate to draw random sets of seeds from a harvested seed sample, and then weigh (in grams) at least three randomly drawn replicate sets of 50 or 100 seeds. After averaging those gram weights, the average can then be divided by the 50 or 100 seed count to compute an average grams/seed value, which in turn can be converted to an average seeds/pound value, as shown in the above equation.
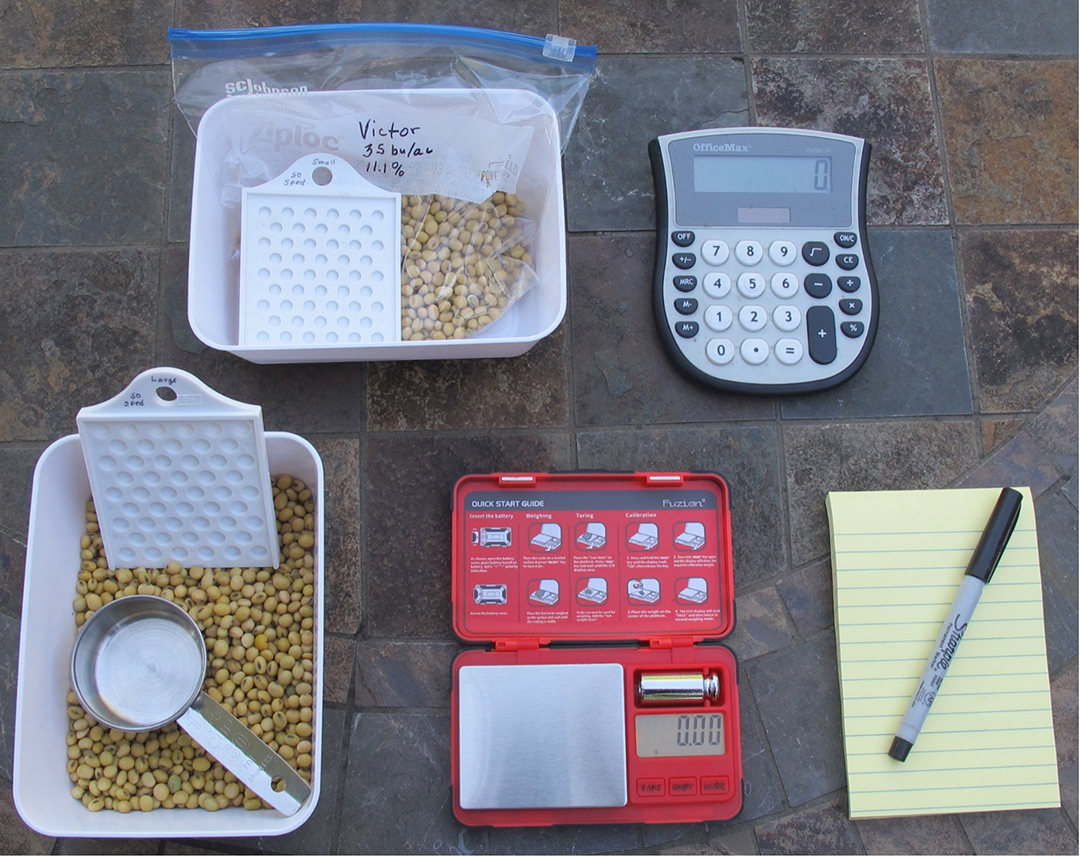
Soybean producers can apply this simplified seed count-gram weight protocol for estimating seeds per pound by acquiring these items:
- A pocket-sized digital scale capable of weighing up to 200 grams with a precision of at least 0.1 or preferably 0.05 grams; preferably one that has a lid cover for portability and includes a 50-gram weight for calibration (currently available online for about $15 from many companies).
- A lightweight 50-hole counting plate that can be easily tared on the mini-scale before randomly drawing a sample of 50 soybean seeds to weigh (available at about $2 each from hobby stores offering bead-size hole counters).
- Several quart-size plastic bags with slider-type sealable tops to store collected seed from combine bins during harvest; bag closure ensures that combine harvest seed moisture content is maintained in the sample until the seed count-weighing protocol can be done.
- A lightweight plastic bowl and a ¼ cup measuring cup to hold soybean seed when drawing random sets of 50-seed count samples.
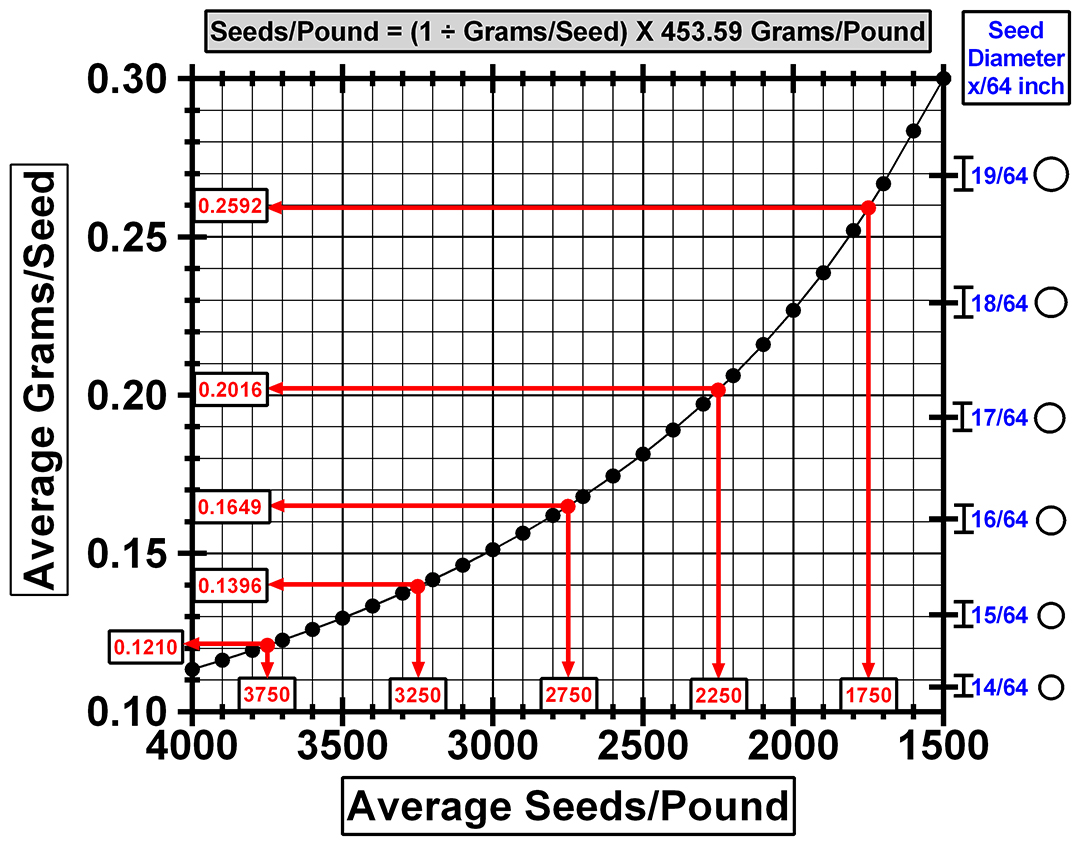
Figure 1 shows a graphical depiction of the inverse relationship between various grams/seed values on the left vertical Y-axis and the corresponding seeds/pound values on the bottom horizontal X-axis. For example, the five red data symbols displaying the horizontal and vertical arrows depict five specific corresponding pairs of grams/seed and seeds/pound values.
In a similar manner, readers who have measured an average grams/seed value for a given field sample can draw a horizontal line across the graph to the nearest black data symbol and from that symbol, draw a vertical line downward to find the corresponding average seeds/pound value.
The right vertical Y-axis shows numerical seed diameters (expressed in x/64th inch units, used in commercial round-hole soybean sieve screens) that correspond to the grams/seed values shown directly across the graph on the left Y-axis. This correspondence relies on the assumption that the near-spherical soybean seeds have a volume density that currently averages to about 1.2 grams/cubic centimeter. This average is based on commonly occurring levels of protein, oil, carbohydrate and water (for 13% moisture seeds) in U.S. soybean seeds. Soybean seed diameter and circumference (shown to scale as bars and circles along the right Y-axis) grow larger the higher the value of grams/seed, in which case there will be larger, but fewer, seeds in the corresponding seeds/pound value.
What is the value to the soybean producer of being able to easily measure seeds/pound?
As noted above, drought in August can lead to crop water stress during the R5-R7 seed-filling stages, which can substantially lessen the size of the seeds developing in the pods because of a slow-down and possibly early shutdown of photosynthetic seed dry matter accumulation. Producers who have center-pivot irrigation fields in which the four corners are not irrigated can compare the seeds per pound parameter in seed samples collected inside the irrigated pivot area to those in rainfed corners to assess the degree to which an August drought-induced reduction in seed size contributed to the irrigated versus rainfed yield differential. Such comparisons can help producers identify planting date, row spacing, and varietal seed size and maturity group options that might help offset the yield reduction risk relative to the probability of drought occurrence in their regions.
Finally, extension specialists who are asked to serve as soybean yield contest judges might consider making a seeds per pound assessment in competing fields.
For example, consider the case of the Georgia producer who, in 2023, reported a record soybean yield of 206.8 bushels per acre and suggested that the harvested seeds likely had a mass of approximately 1,675 seeds per pound (Bennet, 2023). A rearrangement of Equation 2 shows that those two reported field-average values are biophysically plausible only if the average number of seeds produced/harvested in that field was approximately 477 seeds per square foot. The producer stated that the final plant population was 77,000 plants per acre, which when divided by 43,560 square feet per acre is 1.7677 plants per square foot, and dividing that value into the 477 seeds per square foot value indicates about 270 seeds per plant. Dividing that by the current rule-of-thumb 2.5 seeds per pod value would result in a field average of about 108 pods per plant. Soybean yield contest judges using a portable seed mass measurement kit can use these equations to independently report a yield component analysis of soybean yield contest fields.
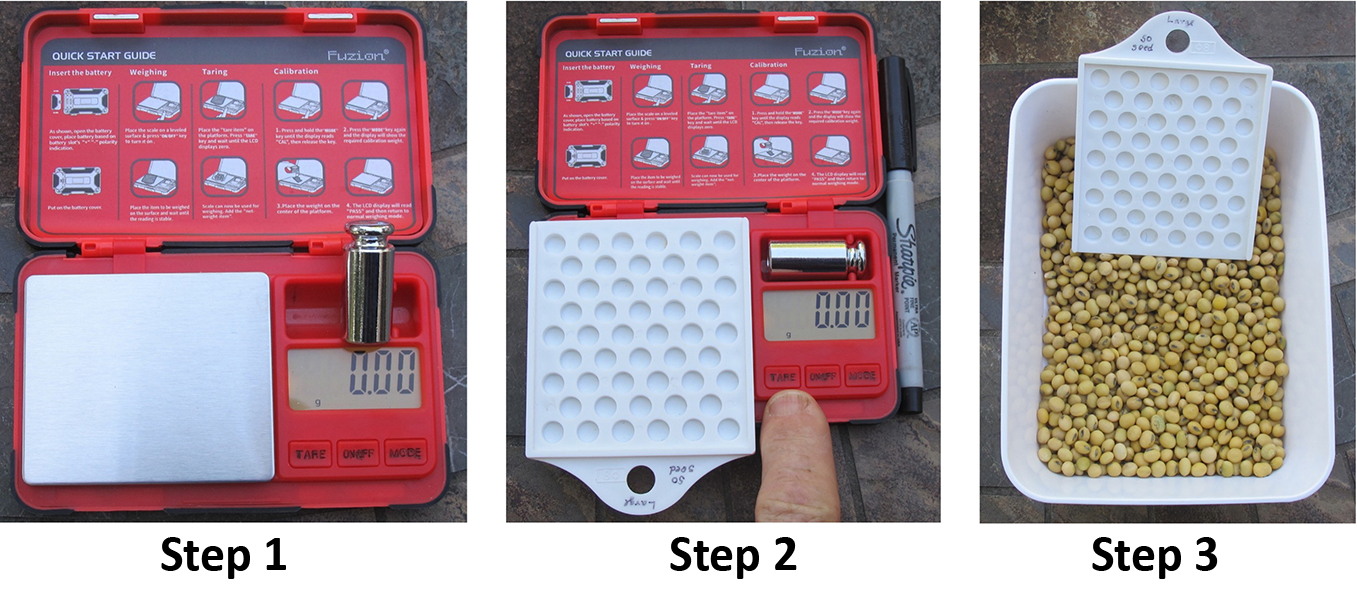
Step 1. Turn on the scale. It should initially read zero grams. If not, follow instructions to calibrate the balance.
Step 2. Place the empty 50-hole soybean counter plate on the scale and press the button to TARE the empty counter to zero grams.
Step 3. Dump some seed from the bagged sample into the bowl, then dip the counter to allow seed to go into the holes. Gently shake the counter plate to let seeds not positioned in the holes roll off and go back into the bowl.
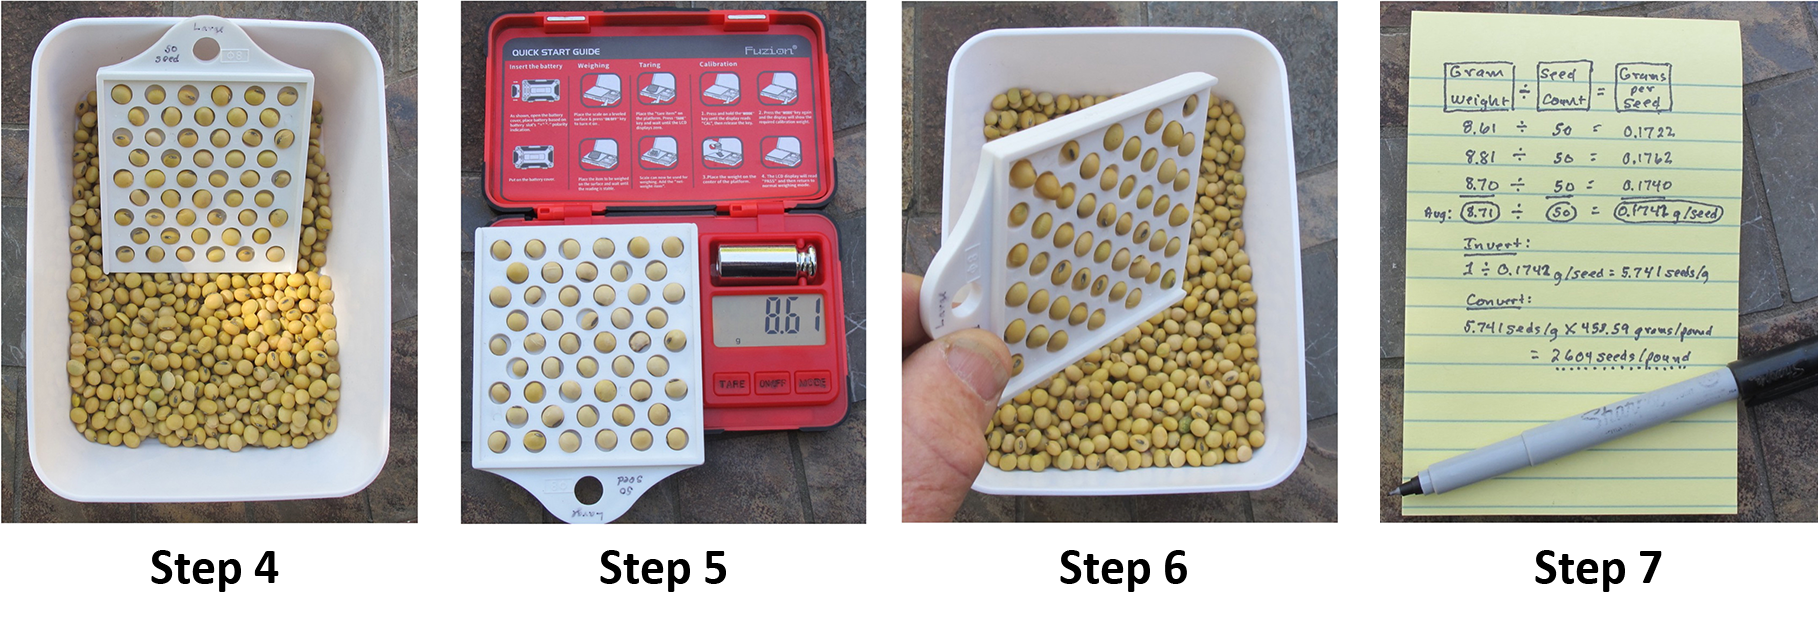
Step 4. Check to confirm there is a seed in each of the 50 holes. Replace a split-half seed or debris with a random seed from the bowl.
Step 5. Place the filled counter on the scale, and record the net 50-seed gram weight.
Step 6. Dump the seeds back into the bowl and repeat to obtain at least three or more 50-seed weights to assess variability.
Step 7. The calculations consist of deriving an average grams/seed value, then inverting it to get seeds/gram, then converting that to get seeds/pound.
Additional Resources
Lee, C. and Herbek, J. 2005. Estimating soybean yield. AGR-188. University of Kentucky Cooperative Extension Service.
https://www2.ca.uky.edu/agcomm/pubs/agr/agr188/agr188.pdf
Licht, M. 2023. Soybean yield estimates. Iowa State University Extension and Outreach.
https://crops.extension.iastate.edu/encyclopedia/soybean-yield-estimates
Bennet, Chris. 2023. Young Farmer Breaks Soybean World Record With a Stunning 206-Bushel Yield. AgWeb.
https://www.agweb.com/news/crops/soybeans/young-farmer-breaks-soybean-world-record-stunning-206-bushel-yield
Boots on the Ground: Validation of Benchmarking Process Through an Integrated On-Farm Partnership – University of Wisconsin Cool Bean article
Benchmarking Soybean Production Systems in the North Central USA – National Soybean Checkoff Research Database
Benchmarking Soybean Production systems in the North Central USA (2016-2018) – National Soybean Checkoff Research Database
Published: Jan 29, 2024


