

Research HighlightsNew uses for precision agriculture
Sensor-ing a change
By Carol Brown, Iowa Soybean Association communications specialist
The agriculture industry has been using sensors in precision agriculture for some time, but researchers at the Iowa Soybean Association (ISA) are pushing the boundaries on what can be discovered with this technology.
For soybean farmers to stay competitive in national and international markets, yield is vital. But now other factors are becoming equally important, including protein and oil content. Can soybean yield and nutritional values be accurately mapped in the field? Can the industry be smarter about soybean seed quality? A project recently underway is exploring these questions.
“In the past, measuring soybean protein and oil content required the collection of soybean seed samples and laboratory analyses,” says Peter Kyveryga, ISA Analytics director. “With recent innovations in sensor technologies, it is now possible to map soybean protein and oil in the field.”
ISA is leading a project with Iowa State University (ISU) and John Deere Co. to map protein and oil content while soybeans are developing and during harvest. The success of this project could impact farmer management decisions and how they grow and market their crop.
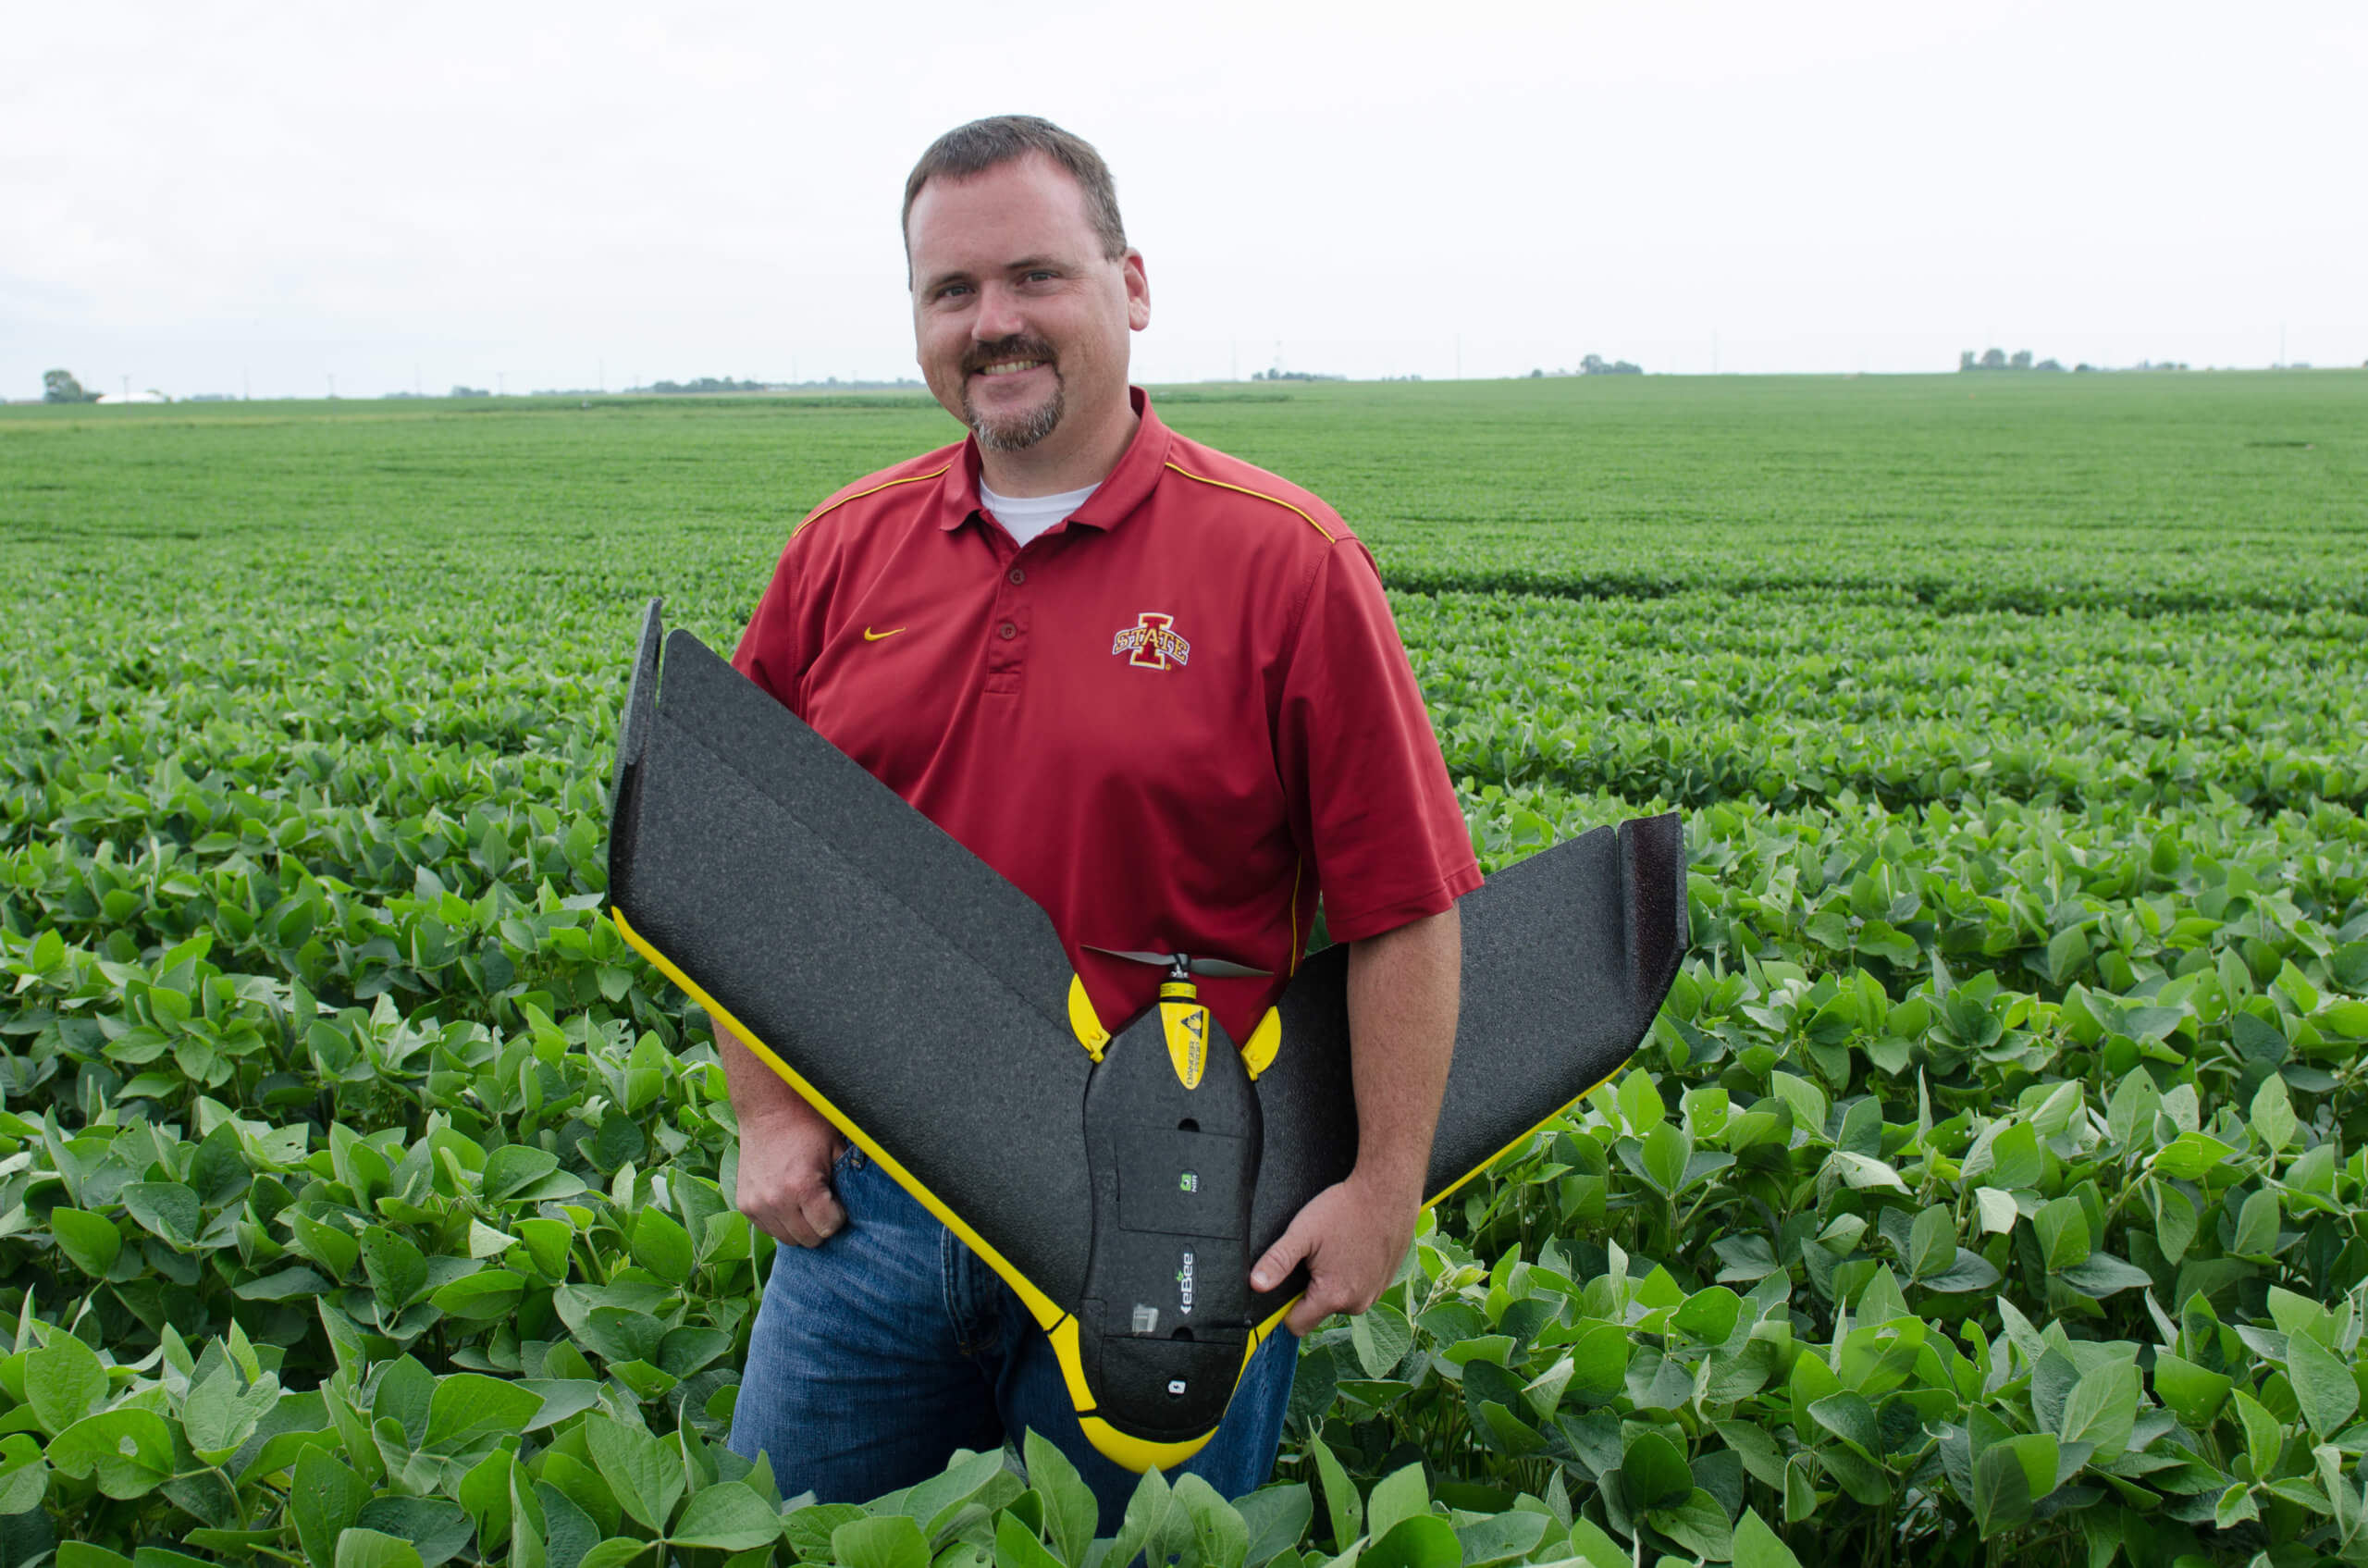
The research team, with support from the United Soybean Board, collected and calibrated aerial images of soybean fields on two central Iowa farms and five ISU research farm fields every 10 to 15 days between June and early September. They studied fields with both 15- and 30-inch rows.
“The researchers have flown over my fields with drones and planes, and they did an intensive probe sampling all across one of the fields,” says Dave Struthers, who farms near Collins. “I’ve got all kinds of colorful maps and lots of data.”
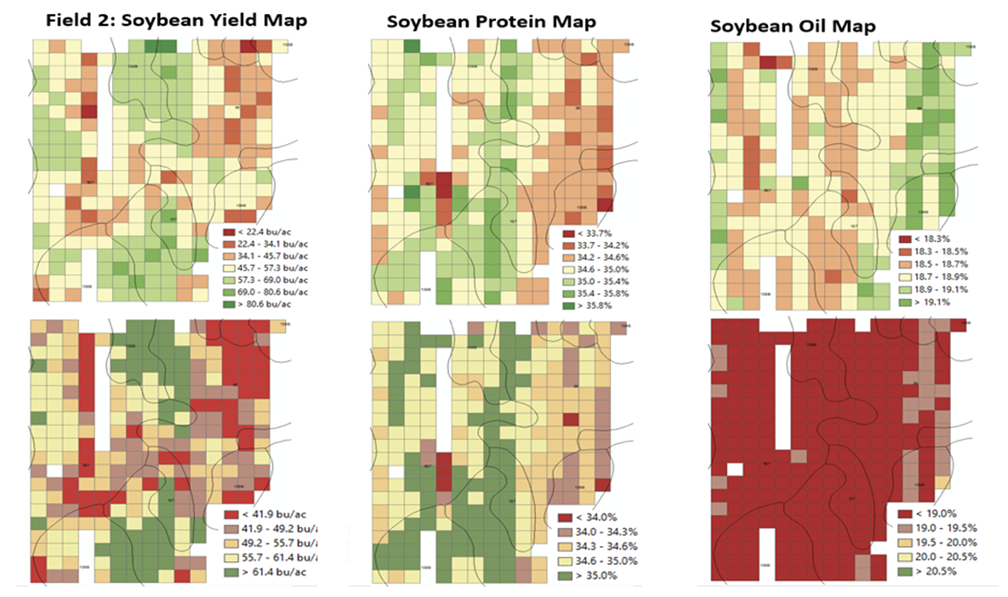
Kyveryga is analyzing that data from the 2018 growing season, which includes yield data, protein and oil maps and in-season aerial images.
“The higher yields don’t always correlate with high protein or high oil values,” says Kyveryga. “In general, field areas with higher protein had lower oil content, but this wasn’t consistent across all the fields.”
Agricultural and Biosystems Engineering professor Matt Darr is the lead from ISU on this project. He believes protein sensing and aerial imagery have a strong future.
“Quantifying the magnitude of soybean protein variability and connecting that to management and environmental factors is the first step toward a higher quality product,” he says.
Aerial imagery offers a unique approach to measure infield variability at a scale that is not available with past technologies, says Darr, who also heads the ISU Digital Agriculture Innovations Team.
“The broad access and low cost of high-resolution imagery today provide researchers and growers with new techniques and insights for crop production,” says Darr.
At harvest, ISU researchers equipped a combine with sensors and collected spatial data from five farmers and ISU research farm fields. They measured yield as well as protein and oil of the harvested grain.
In the 30-inch width rows, protein content tended to be higher with higher yield. In the 15-inch rows, protein decreased when yields dipped below 55 bu/acre and then increased with yields above 55 bu/acre. Two of the seven fields had relatively large areas (up to 60 and 70 percent) that indicated protein content lower than 34 percent.
Three fields had 80 to 95 percent of the area with oil content lower than 19 percent. According to Kyveryga, soybeans with protein lower than 34 percent and oil lower than 19 percent can put the U.S. at a disadvantage in international trade.
“This research is a key aspect of understanding the technology and will be a springboard to fully understand how we can modify our management practices to improve soybean quality,” says Darr.
“It would be good to have this kind of technology someday,” says Struthers. “But there are a lot of steps that would have to happen for farmers to be compensated for soybeans with higher protein or oil content. The processor would need the ability to segregate higher quality beans from the rest and premium pricing scale would also need to be in place.”
In the next phase of the project, through machine learning and analytical methods, the research team will identify factors that might drive spatial variability in soybean protein and oil, including soil, management, weather or genetics. They will collect dense data from soil organic matter and soil testing to look at potential trends between soybean quality and soil fertility.
Kyveryga says researchers will also explore the relationship between amino acid content and different vegetation indices from calibrated aerial imagery collected on the farmers’ fields.
“Using sensors in agriculture was once thought of as futuristic,” says Kyveryga. “This emerging technology of mapping soybean fields for protein and oil content could be beneficial.” Researchers say someday farmers could improve profitability by adopting management practices for better soybean nutritional value.
Published: Jan 1, 1970


