


Research HighlightsKSPB funds research of soybean meal in Nile tilapia diets
By Dr. Carl Webster
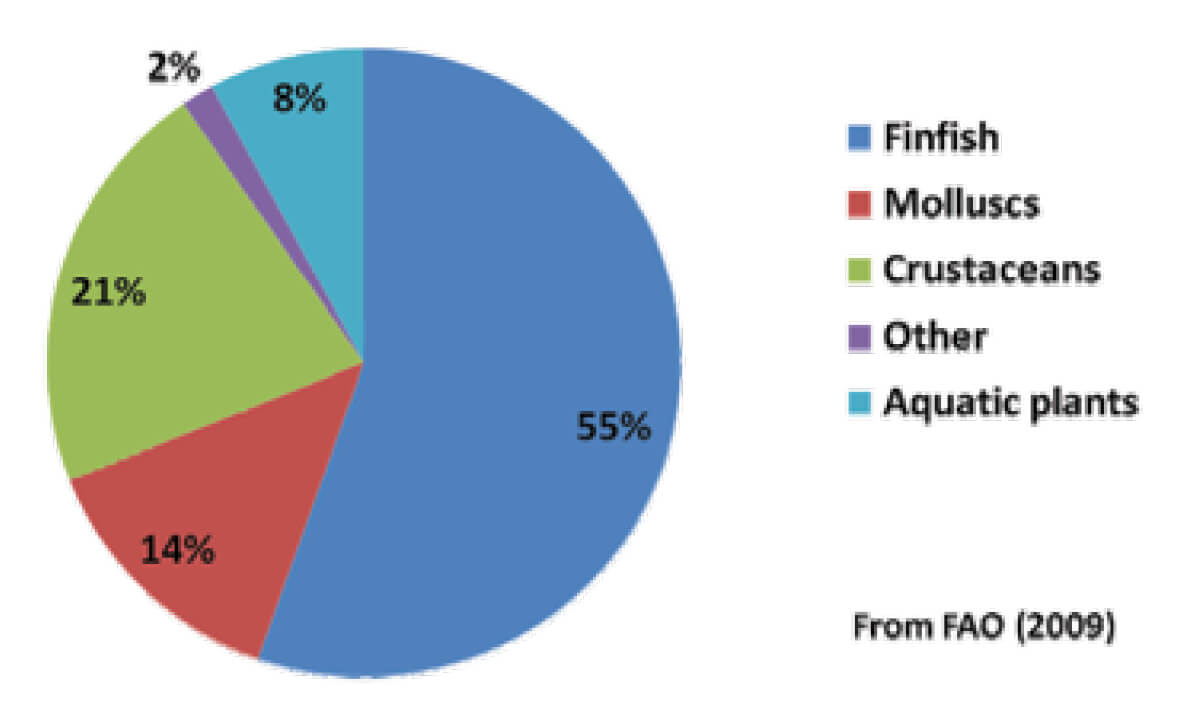
Aquaculture, or fish farming, is the fastest-growing agricultural sector in the United States, with annual growth rates of more than 6% for the past two decades. Globally, fish made up 15% of the average per capita animal protein intake in 2007; aquaculture supplied close to 50% of this demand. Total value of various aquaculture products is shown in Figure 1. Future trends project aquaculture production will continue to rise largely due to the fact that the oceans are being overfished and are reaching their maximum production capacity.
While numerous efforts have been done to preserve the wild fisheries in recent years, there continues to be strong pressures on a variety of wild fish stocks. As the human population continues to expand worldwide, it is essential that seafood supply comes from aquaculture. In the U.S., consumption of tilapia, catfish, salmon and shrimp has boosted the percentage of seafood being produced by aquaculture. However, it should be noted that much of the higher supply to meet this growing demand is imported. Clearly, U.S. producers face strong competition from foreign producers around the world. Therefore, it is essential that domestic producers continue to develop new products and increase production efficiencies of rising aquaculture products, such as tilapia, to compete economically with producers overseas.
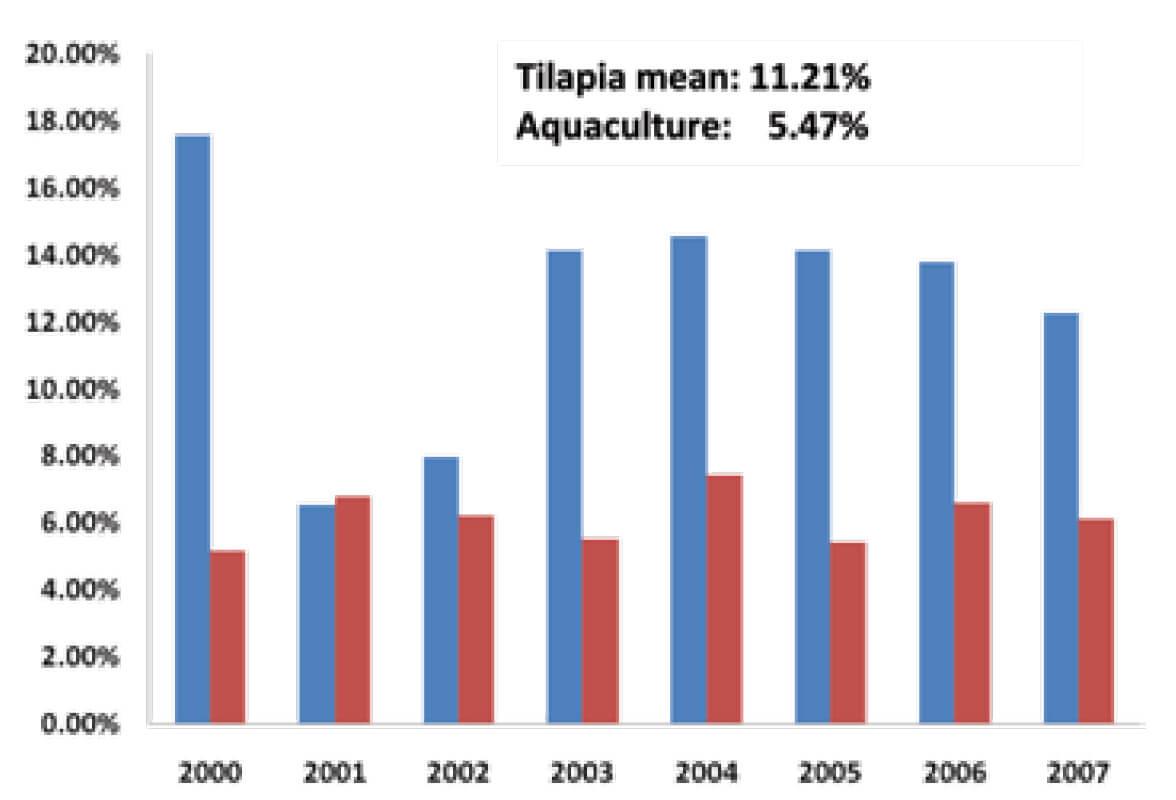
Tilapia are tropical fish endemic to freshwater in Africa, Jordan, and Israel and are being cultured in virtually all types of production systems in both fresh and saltwater in tropical, subtropical and temperate climates. Tilapia have a long history of use as a food source; ancient Egyptians used to feed tilapia that were being held in cages waiting to be taken to market, and it has been speculated that tilapia were the fish from the biblical parable of the loaves and the fishes. Since then, tilapia have been introduced world-wide and production has grown to over 2.2 million metric tons in 2007, with a projected production level of 3 million metric tons in 2010, making it one of the most important farm-raised finfish globally. Tilapia’s acceptance by consumers worldwide is shown on Figure 2, where the annual growth rates are almost twice as big as the overall aquaculture rates. In 2007, tilapia was estimated to be the fourth most consumed finfish in the United States. This widespread success is due, in part, to their high level of adaptability and the ease of production.
Tilapia have sometimes been called “aquatic chicken” due to their rapid growth rates, high-quality flesh, tolerance to disease, adaptability to virtually all types of production systems in tropical to temperate climates, and ability to grow and reproduce in captivity. Currently, they are the second-most produced group of food fish globally (behind carps), and the growth trend is likely to continue. To date, the vast majority of tilapia consumed in the U.S. is produced in China, and Central and South America; however, increasing positive attitude toward local, organically-produced seafood may cause U.S. production of tilapia to rise. Tilapia are produced in intensive production systems, and as a result, it has become important to evaluate diets that are economically and environmentally sustainable, as well as nutritionally complete.
Because diet costs make up the largest expense (40 to 80% of operating expenses) of an intensive aquaculture enterprise, it is essential to evaluate low-cost, nutritious diets to increase profitability for tilapia producers. This could lead to expansion of tilapia farming in the U.S. Currently, fish meal (FM) constitutes a substantial part of a commercial diet formulation of tilapia fry. FM is considered the most desirable animal protein ingredient in aquaculture diets because of its high protein content, balanced amino acid profiles, high digestibility and palatability, and as a source of essential n-3 polyenoic fatty acids. However, FM is one of the most expensive macro-ingredients (used in high percentages) in an aquaculture diet currently costing $900-1100 per ton. With the static or declining fish populations that are used to produce FM, any negative disturbance, supply disruption, or availability problem can lead to dramatic increases in FM prices. The high cost of FM and concerns regarding its future availability have made it imperative for the aquaculture industry to reduce or eliminate FM from fish and crustacean diets.
One approach aquaculture nutritionists have embraced is to partially or totally substitute FM with alternative protein sources, which will alleviate the dependence on marine-derived protein sources, allow for continued expansion of the global aquaculture industry by utilizing renewable ingredients, and possibly decrease diet costs, thereby potentially increasing profits for tilapia producers. It has been found that the use of two or more complimentary protein sources in addition to amino acid, vitamin and mineral supplementation may allow for growth results similar to those found when FM is the primary protein source.
There have been many studies focused on finding protein replacements for fish meal in fish diets. Some of these fish meal replacement candidates include soybean and cottonseed meals, grains, yeast and rendered animal meals. Plant proteins have the advantage of being sustainable, highly available and lower-cost due to their worldwide production. Soybean meal (SBM) is the most widely used plant protein source in aquafeeds and is known to be a cost-effective alternative for high-quality FM in diets for many aquaculture species because of its high protein content, well-balanced amino acid profiles, reasonable price, consistent quality, and steady supply. It has been well documented that SBM has one of the best amino acid profiles of any plant protein feedstuff. However, a diet containing SBM as the sole protein source might be nutritionally incomplete since methionine and lysine are the most limiting amino acids in high-SBM diets.
The use of sustainable, alternative protein sources, such as plant and yeast meals, provides the opportunity for the use of organic diets in aquaculture. Organic agriculture is the fastest growing food production industry in many countries and the sale of organic products increase revenue for producers up to 20% higher than non-organic counterparts. In the U.S., the value of organic agriculture is estimated to be $30 billion annually. However, in order for tilapia to be labeled as organic, they must be fed an organic diet.
In order to evaluate use of organic diets for tilapia, a study was conducted to assess organic yeast (OY) in combination with organic SBM (OSBM) as complete protein replacements for FM in diets for Nile tilapia.
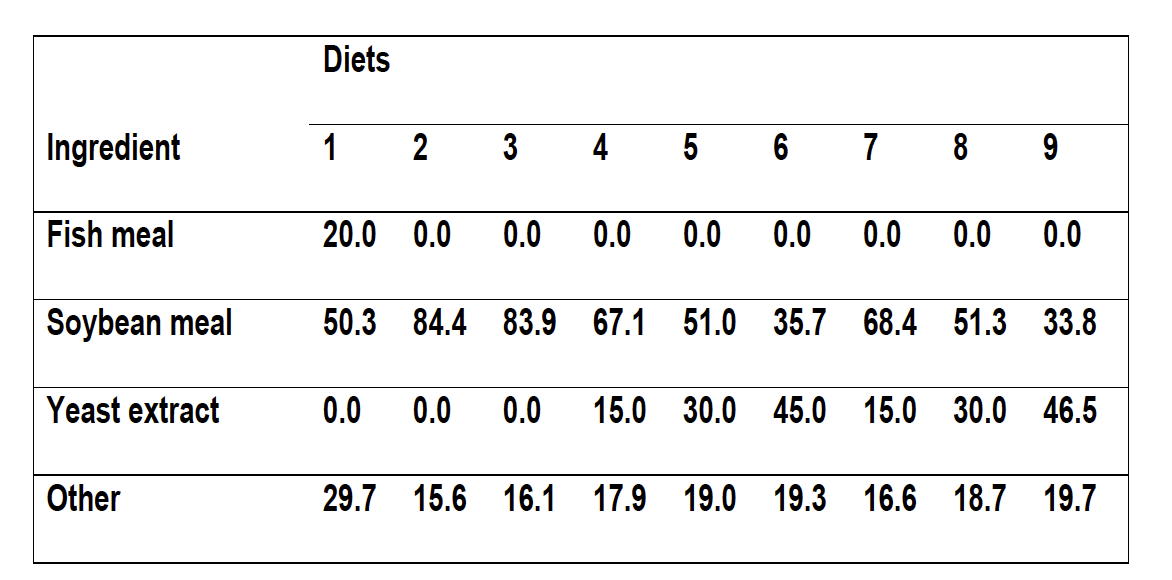
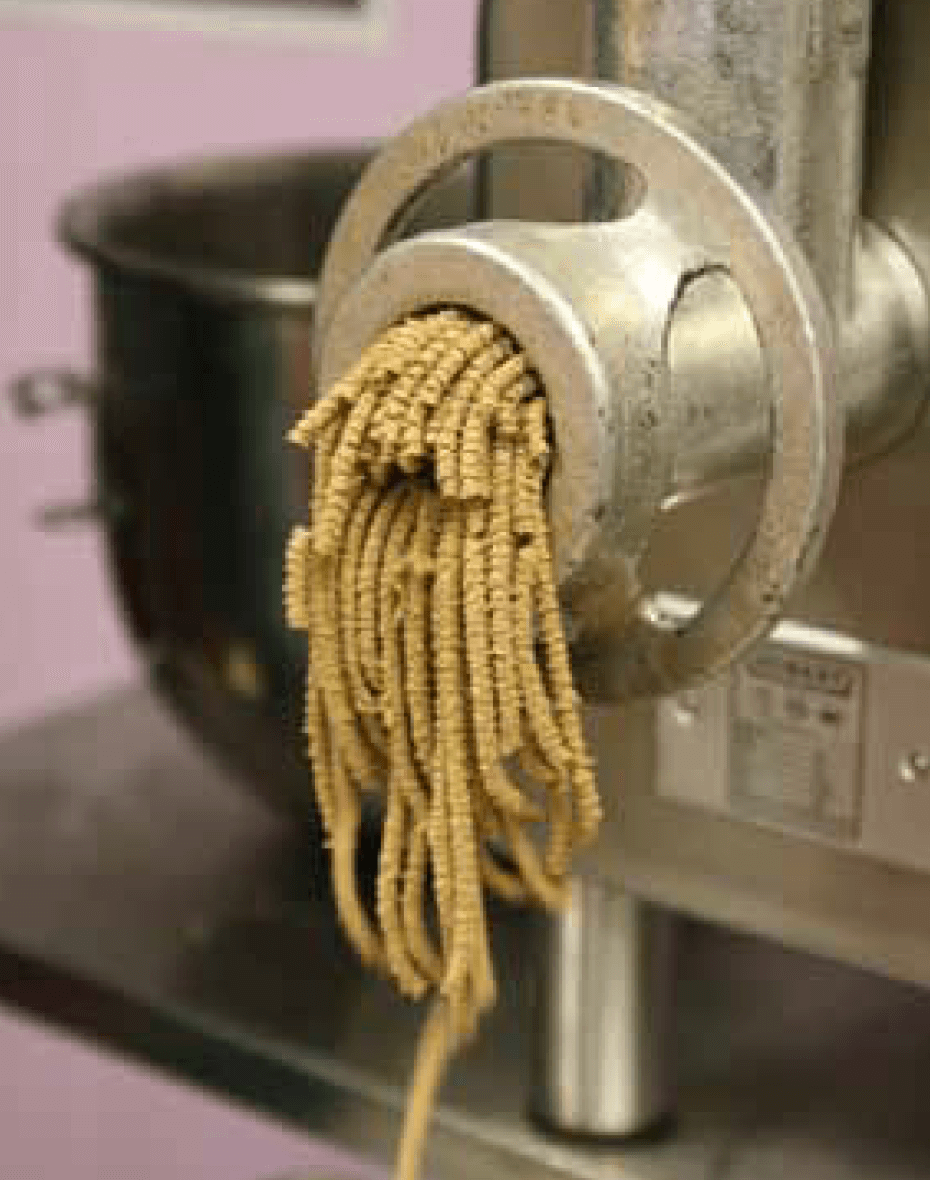
One control diet was formulated similar to a commercially available tilapia diet, while eight experimental diets were formulated to contain organic soybean meal (OSBM) and various levels of organic yeast (OY; 15, 30 and 45%), with and without amino acid supplementation of methionine and lysine, as replacements for menhaden fish meal (Table 1). Diets were extruded into spaghetti-like strands using a 0.5-cm die and air-dried (Figure 3). Once all diets had dried completely, portions of each diet were stored in plastic bags and stored in a freezer until fed.
the study. Photo by Charles Weibel.
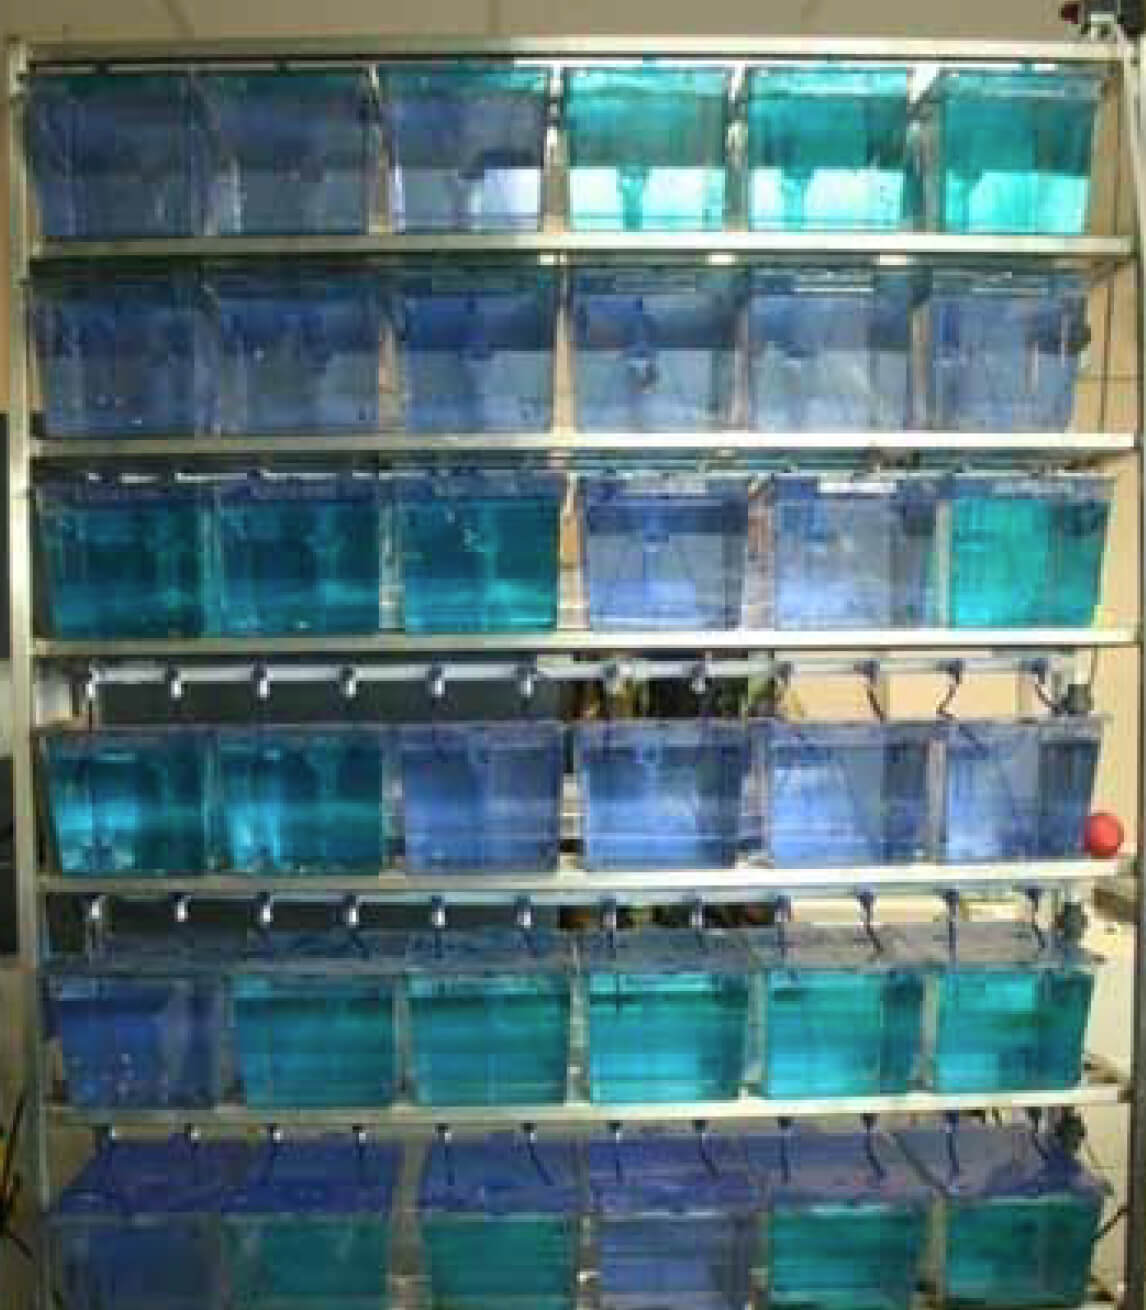
The feeding trial was conducted using a recirculating aquaculture system, comprised of aquaria that drained into a biofilter (Figure 4). Nile tilapia averaging 0.11 g were stocked into each aquarium at 20 fish per aquarium (36 aquaria total). Each aquarium was assigned one of the nine diets. Tilapia was fed three times daily (0800, 1200 and 1600 h) all the diet they could consume for 30 minutes, for six weeks.
After six weeks, final mean weight of fish fed Diet 1 (20% FM and 50.3% SBM) and Diet 9 (0% FM, 33.8% OSBM, and 46.5% OY+AA) was significantly (P < 0.05) higher (4.98 and 4.96 g) than fish fed all other treatment (diets) (Figure 5). Final mean weight increased with increasing OY inclusion in both the non-amino acid-supplemented and the supplemented treatment groups.
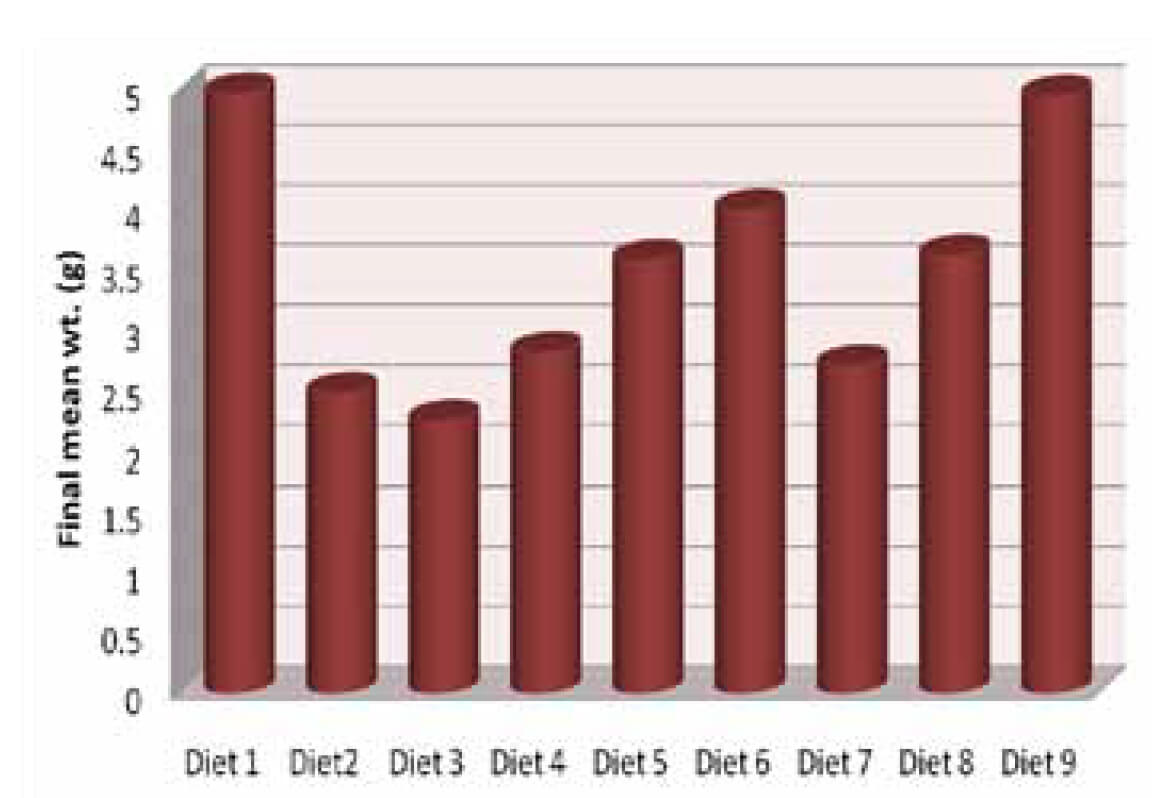
soybean meal and organic yeast. Bars with the same
letter were similar to each other (P < 0.05).
This is the first data evaluating the use of organic SBM and YE as total replacement for FM in Nile tilapia fry. Results indicate that a diet containing 40% protein and formulated to contain 0% FM, 33.8% OSBM, and 46.5% OY, with supplemental methionine and lysine, may be sufficient for Nile tilapia fry as this diet did not produce any adverse effects on final mean weight. While information about specific nutritional requirements and practical diet formulations for tilapia has been widely studied, there is little information on the partial or total replacement of FM with less expensive organic plant protein sources. Replacement of FM with less expensive protein sources, such as OSBM and OY, may help contribute to a reduction in diet costs and thereby increase profits for producers. In addition, organically-grown tilapia may offer a broader marketing-base for tilapia producers, while at the same time increase the value compared to traditional non-organically grown products. This study could lead to domestic production of certified organically-grown tilapia which might allow farmers to market a product that foreign competitors do not currently have, at the same time allow for the use of domestic SBM. Further studies need to be conducted on the use of SBM, FM replacement in aquaculture diets, and tilapia.
This research was partially funded by the Kentucky Soybean Promotion Board, a USDA Capacity Building Grant, and a USDA grant under agreement KYX-80-09-18A to Kentucky State University.
Published: Dec 16, 2019


