

Research HighlightsBoots on the Ground: Validation of the Benchmarking Process Through On-Farm Trials
By Julie Meyer
What causes yield to be lower than the potential yield of a particular soybean field? In the first four years of this project, thousands of soybean farmers in 10 North Central states (NE, WI, MI, IN, IL, IA, ND, OH, KS, and MN) voluntarily provided specific information about their farming practices to help answer that question.
With checkoff funding provided by the North Central Soybean Research Program (NCSRP), Nebraska Soybean Board, and Wisconsin Soybean Marketing Board, a network of local crop consultants, extension educators, and soybean grower boards distributed surveys in which farmers were asked to report the average yield for a number of fields planted with soybean. Requested information also included planting date, seeding rate, row spacing, cultivar, tillage method, irrigation, and inputs of fertilizer, lime, manure, and pesticides. Any incidence of pests, diseases, weeds or environmental adversities such as hail, waterlogging, and frost were also noted on the survey form.
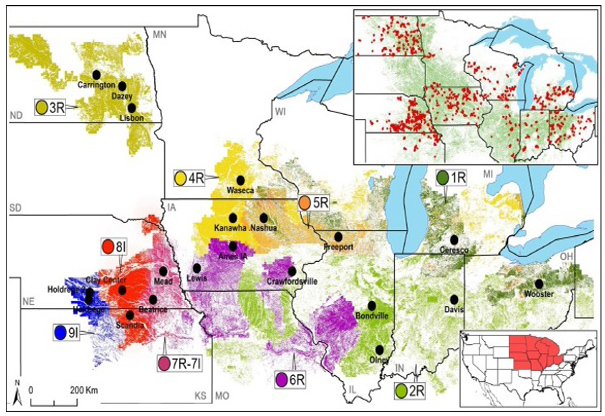
In order to best use the information, agronomists Patricio Grassini, University of Nebraska, and Shawn Conley, at the University of Wisconsin, constructed a geographical framework of distinct areas of similar climate and soil conditions, and, therefore, where a similar yield response to a given set of management practices would be expected. These areas are called Technology Extrapolation Domains or TEDS (see Figure 1) and were used to analyze the over 6,000 farmer surveys that were returned.
The analysis revealed that (1) there is an average yield gap of 20-30 percent between current farmer yield and potential yield as determined by climate, soil, and genetics, and (2) there are a number of agronomic practices that, for a given soil-climate context, can be fine-tuned to close the gap and improve soybean producer profit.
For details, read Key Management Practices That Explain Soybean Yield Gaps Across the North Central U.S. and Benchmarking Soybean Production Systems in the North Central U.S.
Phase 2: Closing the Yield Gap
Phase 2 of the project is now in full swing. In this phase, on-farm trials are being conducted in each TED, based on what the farmers in that area are currently doing, and comparing that with a system of candidate management practices that were related to yield gaps in the first phase of the benchmarking project. A big advantage of using farmer-supplied information is that it allows examination of opportunities for yield increase within the range of current management practices that are cost-effective and logistically feasible in farmer fields.
For example, in 2019, 49 replicated on-farm trials in seven states were initiated to compare an improved treatment versus the reference producer practices. Fields for the on-farm trials were chosen to be representative of the average farmer in each TED, that is, with yields and practices that do not deviate substantially from the average in the region.
The “improved” management was specifically designed for each TED in each state by fine-tuning planting date (usually involved earlier planting), lower seeding rate, insecticide and fungicide applications, and in some cases, fine-tuning cultivar maturity group.
When designing the specific treatment for each TED, the aim was to have a “system comparison” in which a management practice is modified, but other practices within the farming system are also modified if needed, so that the yield benefit associated with the change can be fully optimized.
The initial results look promising. The researchers found that yield increase, together with lower costs due to lower seeding rate, resulted on average +$51/acre extra net profit in the “improved” management treatment compared with the “reference” treatment.
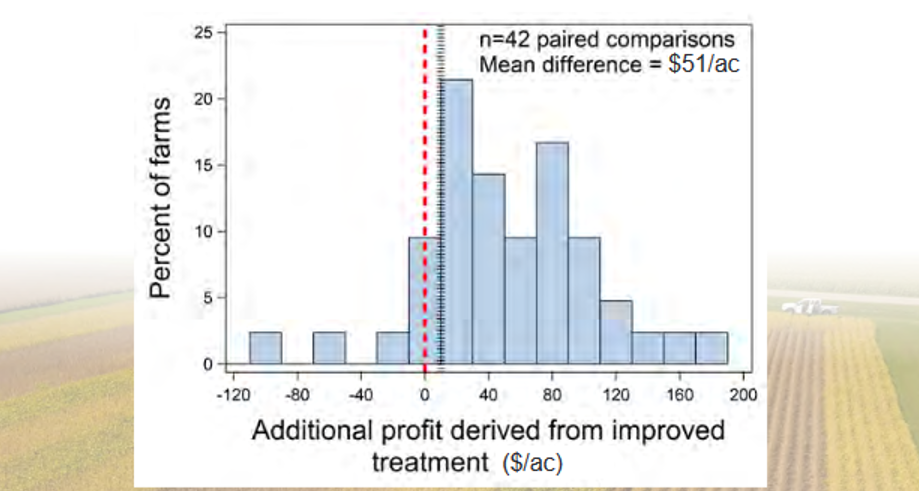
The additional profit derived from the “improved” management was higher than $10/acre profit in 85 percent of the cases. In other words, the economic impact derived from the “improved” treatment was high and consistent across farms. See Figure 2 from the report: Boots on the Ground: Validation of benchmarking process through an integrated on-farm partnership.
For more information:
Management Considerations for Early and Late-Planted Soybean in the North Central US. Agronomy Journal, May 2020.
Combining field-level data and remote sensing to understand impact of management practices on producer yields. Field Crops Research, October 2020
Published: Feb 8, 2021


