

Research HighlightsBean Binoculars: New Interactive Tool Tracks Soybean Issues in Real Time
In this article, you’ll find details on:
- A collaboration of soybean outreach organizations has created an interactive tool, Bean Binoculars, to document and display soybean production issues in real time across the country.
- Bean Binoculars is used to keep growers up-to-date on regional and national soybean issues; elevate research-based information from trusted sources; and to catalog soybean issues into a comprehensive online database.
By Carol Brown
A group of soybean organizations have united to improve outreach to farmers, extension employees and fellow researchers. They have created a new interactive tool, Bean Binoculars, which is an interactive map that pinpoints various soybean production issues across the country.
“We have contributors dispersed across the country to report incidents to add to the map,” says Haleigh Ortmeier-Clarke, program manager at North Carolina State University, who manages the tool. “We want farmers to know that the reports are coming from credible sources — those experts who are actively in the fields and working with growers on finding and troubleshooting issues.”
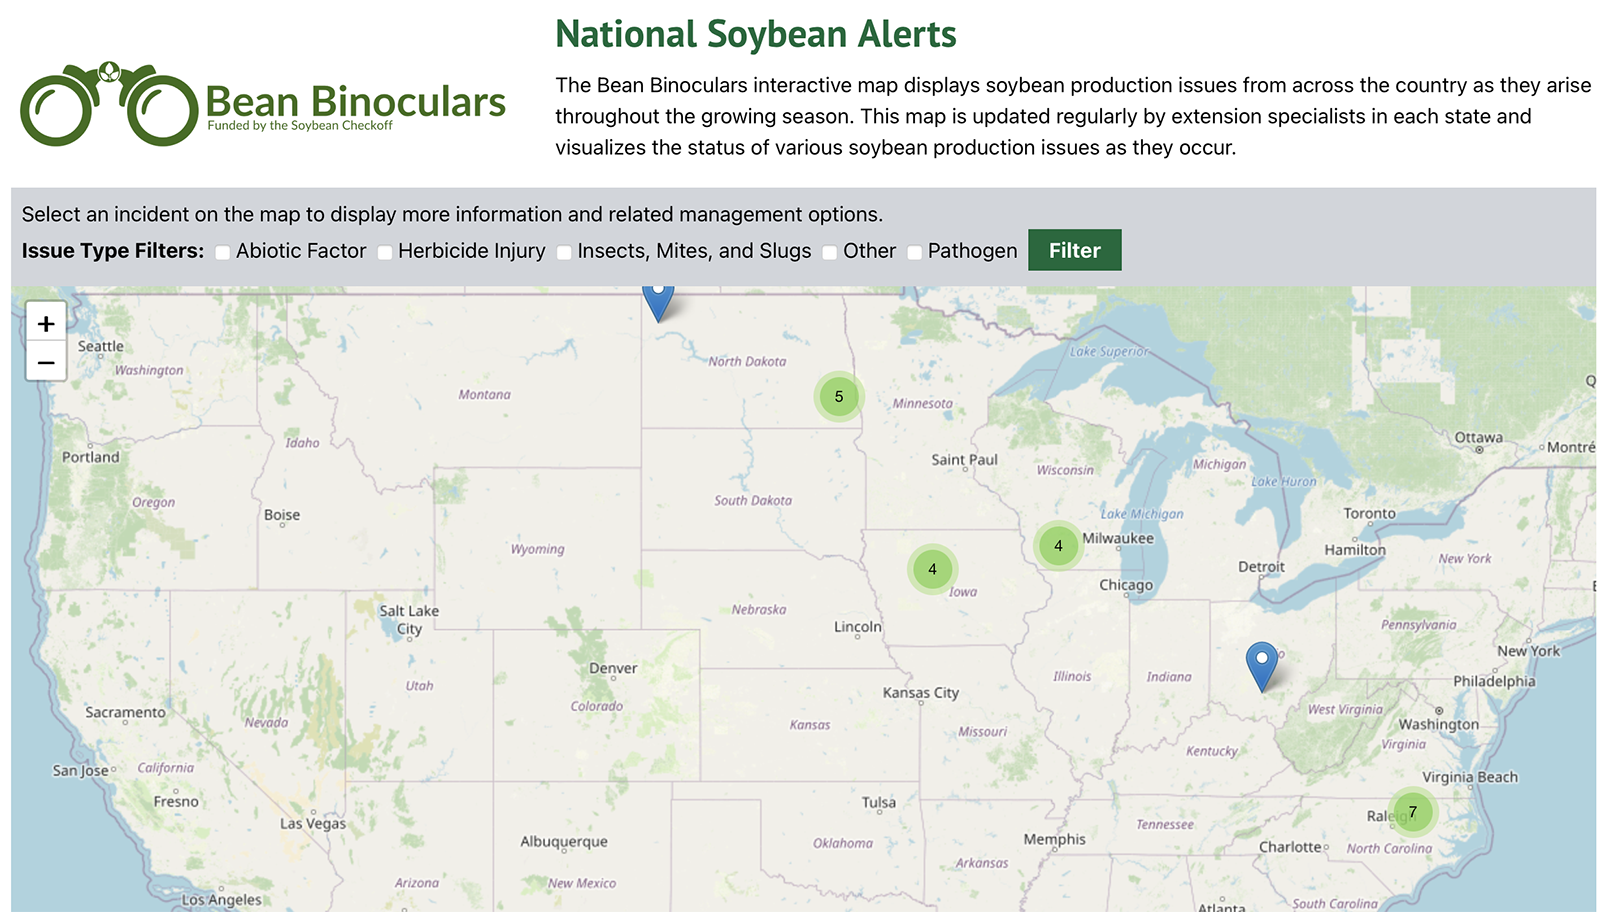
Issues on the Bean Binoculars map range from disease breakouts, presence of insects and other pests, nutrient deficiencies, weeds, and other concerns such as flooding or drought. Users of the tool can zoom in to their geographic area of interest and click on the pinpoint to see what has been reported. Clicking again on the incidence description pulls up details including dates reported, the county it was found in, management recommendations, and descriptive photos.
“People using the tool can filter for certain issues such as pathogens and insects,” says Ortmeier-Clarke. “While the tool is still in its pilot year, we are seeing an increase in entries as we get further along in the growing season.”
Bean Binoculars is housed on the Crop Protection Network website, linked under “Tools” on the homepage. The tool is updated as needed with reports by university extension soybean specialists and other contributors including university researchers and vetted crop consultants. Ortmeier-Clarke says contributors for the tool continue to be added.
Each year, the tool will start again with live reports, but there is an “Incident Archive” link that catalogs previous reports. This will be a good way to identify regional, long-term problems and to mark historical happenings like hail and other weather damage.
“We believe there’s educational value in releasing a map like this and we’re excited about the impact this can have for a diverse set of soybean stakeholders including farmers, crop consultants, extension employees and students on campus,” says Rachel Vann, NCSU soybean specialist and program leader for the Better Together Initiative. “Taking the time to document some of these issues in real time with high-quality photos and associated research-based information will aid in both short and long-term management decisions.”
Bean Binoculars is a product from the Better Together group, which is supported by the United Soybean Board. Better Together is a collaboration between Crop Protection Network, Science for Success, GROW/Take Action, the SCN Coalition, and their soybean checkoff partners including the Soybean Research & Information Network.
Visit Bean Binoculars: https://go.ncsu.edu/beanbinoculars
Published: Sep 26, 2024


