

Research Highlights2019 variety trial results are in
By Dr. Claire Venard
University of Kentucky Agriculture Research Specialist
Soybean is an important crop in Kentucky agricultural production. Since 1956, the Kentucky Soybean Variety Trials have been conducted yearly to provide an unbiased and objective estimate of the relative performance of commercial soybean varieties in Kentucky. Every year new technologies, new varieties are available to soybean producers and tested in the trials. The trials expose the varieties to multiple environments. Soybean performance, as defined by yield and seed quality at harvest, is evaluated at harvest. The information provided by the soybean variety trials may be used by growers and seed producers to aid in selecting the best varieties for their specific production system.
In 2019, the soybean variety performance tests were conducted in all major regions of soybean production in Kentucky. Soybean cultivars in the trials were entered by soybean growers, commercial companies, and state and federal institutions. 154 conventional, organic (treated as conventional), and genetically engineered soybean varieties were accepted.
Five test sites were hosted by soybean producers, in Allen County, Christian County, Cumberland County, McLean County, and Meade County. Three other sites were hosted at research farms, at the Murray State University Research Farm, the UK Research and Education Center in Princeton, and at the UK Spindletop North Research Farm. Five tests were planted as full-season soybean at each site: 3 varieties in the Maturity Group 2 (2.0-2.9), 33 varieties in MG 3 (3.0-3.9), 50 varieties in the MG 4 Early (4.0-4.5), 57 varieties in the MG 4 Late (4.6-4.9), and 11 varieties in the MG 5 (5.0-5.9). Planting started on May 8. All varieties were planted in 3 replicates as 16-feet long plots at each test site, in randomized complete blocks within their maturity groups, with a no-till 15-inch 6-row plot planter (SNT-25 model, Haldrup USA). After planting, the plots were maintained as weed free as possible using a conventional herbicide program. Development, maturity, diseases, pests, and environmental conditions were monitored at all test sites during the growing season. Harvest was conducted from September 30 to October 24. The four inner rows of each plot were harvested with a small combine (Delta model – Wintersteiger, USA) equipped with an electronic monitor to collect the weight and moisture of the seed from each plot (HarvestMaster HM800 GrainGage system, Juniper Systems, Inc., USA).
The 2019 yield data are currently available for download from the University of Kentucky KY soybean variety performance tests website (http://pss.ca.uky.edu/extension/soybean-variety-trials) as an excel file using the “2019 Kentucky Soybean Variety Trials – Yield results” link. Performance of soybean varieties varies from year to year, and from site to site, depending on genetic adaptability, weather conditions, and management practices. Therefore, performance of a variety across a period of years and at several locations in the state is the best indicator of its production potential. The Recommended Table presents data collected and analyzed over the course of three full-seasons. Small differences in yield are usually of little importance. Two varieties can differ simply because of small differences in soil fertility or moisture, although the inherent yielding ability is the same. To decide if an observed yield difference is real, the least significant difference (LSD) value should be used. If the difference in yield between two varieties is greater than the LSD value, it is reason-able to assume that the varieties do differ in their yielding ability.
The Kentucky 2019 growing season differed greatly from the 2018 and 2017 seasons. 2019 started with warm temperatures and normal precipitation in April. However, in May, different areas in Kentucky experienced uneven environmental conditions. While the state did see some flooding early in the month, weather conditions were mostly dry, running below normal for three straight weeks. In fact, Kentucky was 1 inch below normal precipitation in average, with some areas around Bowling Green 3 to 4 inches below normal. In addition, elevated temperatures and humidity made May feel like the middle of summer.
After a dry and hot May, Kentucky received an average of 7.78 inches of rainfall for June. Consistent rainfalls kept temperatures slightly below normal except for the last week, when heat started to build up.
In July, Kentucky averaged 5.04 inches for the month and temperatures were consistently in the middle 80s to low 90s. Most of the precipitation fell over the first half of the month as the remnants of tropical storm Barry moved through the region. North Central Kentucky however missed on most of the rain throughout July.
Some portions of the state became extremely dry over the first half of August. By the twentieth, moderate drought was introduced by the US Drought Monitor, and was severely felt across North Central and Southeastern Kentucky. The state saw three straight weeks with below average precipitation as rainfalls remained scattered. Rain activity came back over the last couple of weeks of the month, and averaged 1.26 inches.
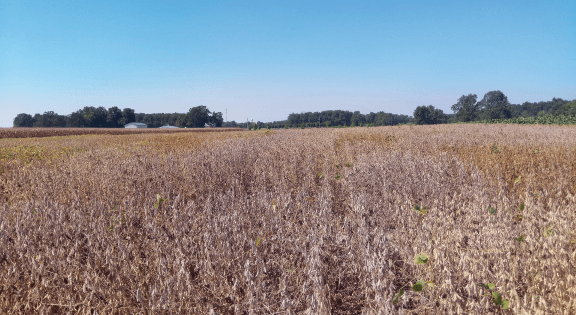
September 2019 was the driest September Kentucky has ever seen since 1895. The state averaged 0.23 inches for the month, with only 0.06 inches through the first half. In addition to the dryness, heat developed across the state with highs in the low 90s. By the end of the month, a small section of Southeastern Kentucky was upgraded to an extreme drought by the US Drought Monitor, while severe drought was expanded to cover 58 percent of the state. Harvest progressed at a rapid pace but dry down was also rapid this year, with county agents reporting moisture for soybeans at 7, 8, 9 percent.
The soybean variety performance trials experienced the same weather conditions as did Kentucky soybean producers over the course of the 2019 growing season. Prematurely dying soybeans were observed in September at pretty much all of the test sites. Soybean varieties died at the same time with nearly no difference between maturity groups, and plants still had the petiole of their dried-up leaves attached to the main stems. The grain filling R6 stage is defined by green seed in the pod cavity and when the dry weight accumulation is very rapid. Any stress during this very sensitive physiological process will affect yield and seed quality. In order to compare the performance of soybean varieties one to another, and across years and locations, the yield of each variety is calculated for the moisture in the seed adjusted at 13%. The 2019 yields at 13 percent moisture reach 59 bushels per acre for the maturity group 2, 68 bu/ac for the MG 3 and 4 early, and 65 bu/ac for the MG 4 late and 5. The results also showed that two of the soybean trials fields yielded better, in Princeton and Cumberland County, while the others were likely impacted by the dry conditions. The environmental data collected at each test site are currently being analyzed.
Good soybean variety selection is essential to maximize profitability. Each year new soybean varieties enter the market and older varieties leave the market. New technologies, new seed treatments are available every year. This means that variety selection decisions must be made each and every year. Yield is only one of the many factors to consider in selecting a variety for a production system. Seed composition, oil and protein content, date of maturity, plant height, lodging resistance, pest management, availability of time and equipment, weed control costs, and farm economic management should be considered as well. In case of known soybean cyst nematode and other pathogens problems, resistant varieties should be with a crop rotation program. The Kentucky Grain Crops website provides links to many resources.
This work is supported by the Kentucky Soybean Promotion Board, and by the National Institute of Food and Agriculture, US Department of Agriculture (Hatch Project KY006099, accession # 101341). The source of information for the weather conditions during the growing season is the UK Ag Weather center.
Published: Dec 19, 2019


